Cross-Sport Data Patterns: Linking Venue Histories With Series Progressions for Targeted Market Selections
Clara Hughes · Sep 22, 2026

Cross-Sport Data Patterns: Linking Venue Histories With Series Progressions for Targeted Market Selections
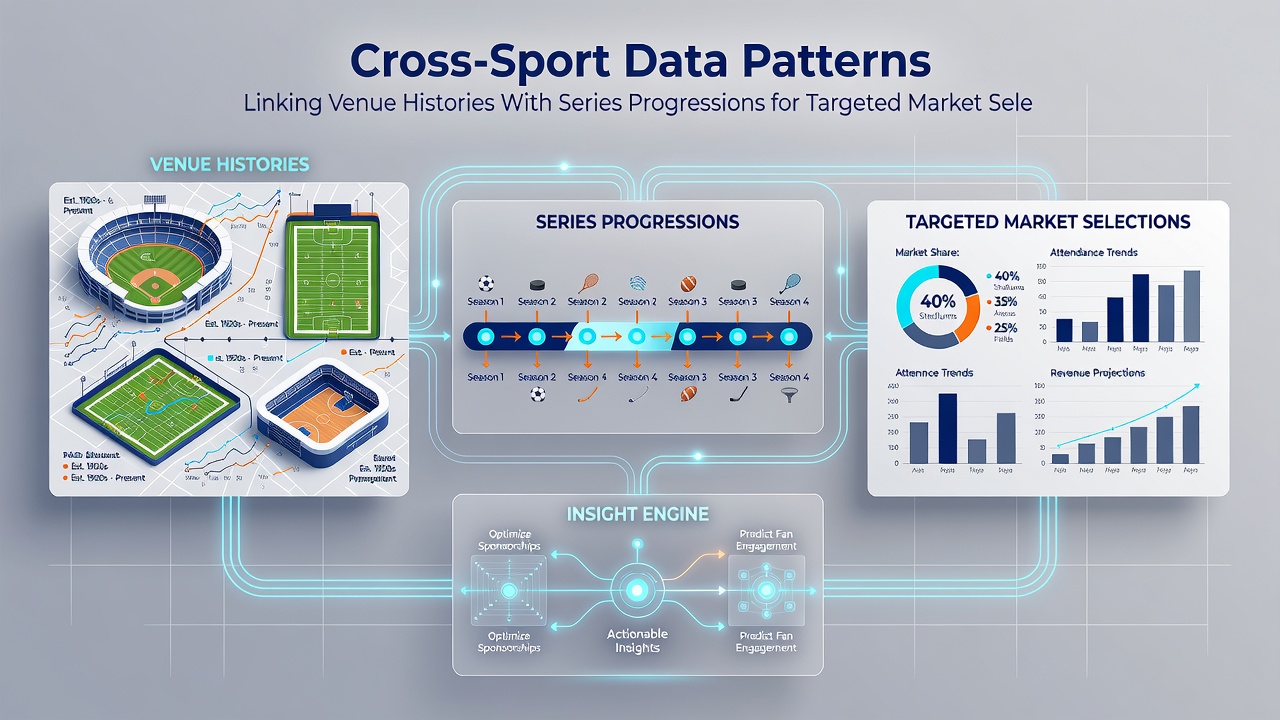
Analysts have long tracked how specific venues shape outcomes in multi-game series across sports such as tennis, baseball, basketball and cricket, and the patterns that emerge when historical venue data intersects with series length and progression metrics. Researchers compile decades of match logs, travel schedules and surface conditions to identify recurring sequences where certain locations consistently influence win probabilities at particular stages of best-of-five or best-of-seven formats. Data from major tournaments held between 2020 and 2025 shows that venues with pronounced altitude or climate effects tend to produce shorter series when the home side secures early momentum, while neutral or indoor sites often extend contests into decisive later games.
Venue Histories Across Disciplines
Baseball stadiums in high-altitude regions have recorded elevated run totals in early innings of playoff series according to records maintained by league statisticians, and cricket grounds with short boundaries display similar scoring spikes during limited-overs knockout stages. Tennis hard-court arenas in desert climates demonstrate higher first-serve percentages for players who adapt quickly to the surface speed, a factor that frequently decides opening matches in best-of-five encounters. Observers note that basketball arenas located in humid subtropical zones correlate with increased three-point shooting variance during conference finals, particularly when teams face back-to-back travel days. These venue-specific tendencies become more pronounced when series reach game four or five, because fatigue compounds the physical demands already shaped by the location.
Series Progression Metrics
Progression metrics track how often a series concludes in the minimum number of games versus how frequently it stretches to its full length, and venue history supplies one of the strongest predictive variables. Studies of international cricket test series reveal that grounds with extreme heat indexes see a higher percentage of matches finish inside four days when the touring side wins the toss and bowls first. In professional baseball, postseason data from 2018 onward indicates that ballparks with pronounced left-field dimensions produce more extra-inning games in best-of-seven matchups once the series is tied at two wins apiece. Analysts cross-reference these figures with travel distance and rest intervals to isolate the contribution of venue alone, and the resulting models assign weighted values to each factor for market-selection purposes.
Cross-Sport Pattern Recognition
Pattern recognition software now aggregates venue data from disparate leagues into unified datasets, allowing comparisons that were previously difficult to draw. One dataset compiled by academic researchers links indoor arena humidity levels in basketball with equivalent dew-point readings at outdoor tennis venues, revealing parallel effects on player endurance during five-set matches and seven-game series. Another study examines how travel across time zones influences basketball and baseball teams differently when they move from sea-level venues to mountain sites, and the findings show measurable drops in late-game performance metrics after the third contest in a series. These cross-sport linkages help identify markets where historical venue bias is likely to override recent form, especially during September 2026 when multiple leagues schedule high-stakes series in rapid succession.
Targeted Market Applications
Market selection based on these patterns focuses on over-under totals, series-length propositions and player-performance spreads that align with documented venue tendencies. Data indicates that cricket grounds with fast outfields produce higher over totals in the first two matches of a five-game limited-overs series, after which bowlers adjust and scoring rates stabilize. Baseball markets tied to run totals at specific stadiums show similar early-series elevation followed by regression once pitchers adapt to the dimensions. Tennis set-over markets at high-bounce venues display elevated totals in the opening two sets of best-of-five encounters, with the probability shifting toward unders once the series reaches a 2-1 scoreline. Practitioners integrate these venue-adjusted probabilities into selection frameworks that also account for roster changes and scheduling density.
Data Integration Methods
Integration methods combine public box-score archives with proprietary tracking data from optical and wearable sensors, creating layered models that update after each completed game. Regulatory bodies such as the Gambling Research Australia have published guidelines on responsible use of performance datasets, while the National Council on Problem Gambling in the United States provides parallel recommendations for data transparency in sports wagering markets. Analysts apply these standards when constructing filters that isolate venue-series interactions from broader seasonal trends, ensuring selections rest on measurable historical frequencies rather than anecdotal observation.
Conclusion
Venue histories and series-progression statistics together supply a structured lens for examining cross-sport betting markets, and the patterns that surface from consistent data aggregation continue to refine selection criteria as new seasons unfold. Continued collection of granular metrics through 2026 and beyond will allow further calibration of these models across additional disciplines and geographic regions.